Contents

What is IM?
Description: Inventory Management (IM) involves overseeing and controlling stock levels to ensure optimal supply and demand balance.

Types of IM
Description: Types of inventory management include just-in-time (JIT), ABC analysis, FIFO, LIFO, and perpetual inventory systems.

How Much Stock We Should Have
Description: Determining stock levels involves demand forecasting, safety stock calculation, lead time, and inventory turnover rates.

Inventory Optimization
Description: Inventory optimization balances stock levels to minimize costs while meeting demand, improving efficiency, and reducing excess inventory.

Cost of Inventory
Description: The cost of inventory includes purchasing costs, holding costs, ordering costs, and stockout costs, impacting overall profitability.

IM Keyword Management
Description: IM keyword management involves optimizing inventory-related keywords for search engine visibility, driving relevant traffic, and enhancing online presence.

Types of Safety Stock Techniques
Description: Types of safety stock techniques include fixed, variable, dynamic, service level-based, and statistical approaches for risk management.

Safety Stock and Reorder Point
Description: Safety stock buffers against demand variability, while the reorder point triggers new orders before stock depletion.

Introduction to EOQ
Description: EOQ (Economic Order Quantity) calculates the optimal order size to minimize total inventory costs effectively.
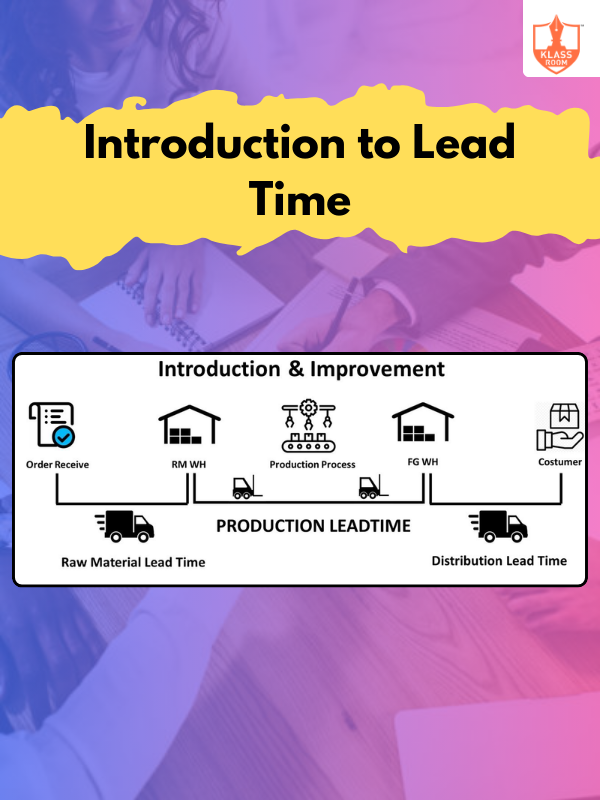
Introduction to Lead Time
Description: Lead time is the total time from ordering to receiving goods, impacting inventory and planning.

EOQ With and Without Lead Time
Description: EOQ with lead time considers delay in delivery, while EOQ without lead time assumes immediate availability.
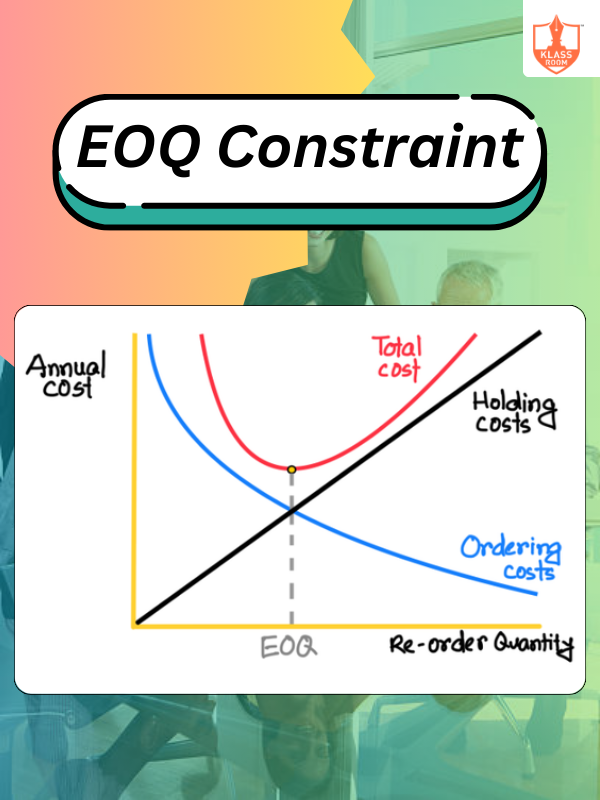
EOQ Constraint
Description: EOQ constraints include limited storage capacity, fluctuating demand, and supplier limitations affecting optimal order quantity.

EOQ with Discount
Description: EOQ with discount calculates the optimal order quantity accounting for price reductions, minimizing total inventory costs.
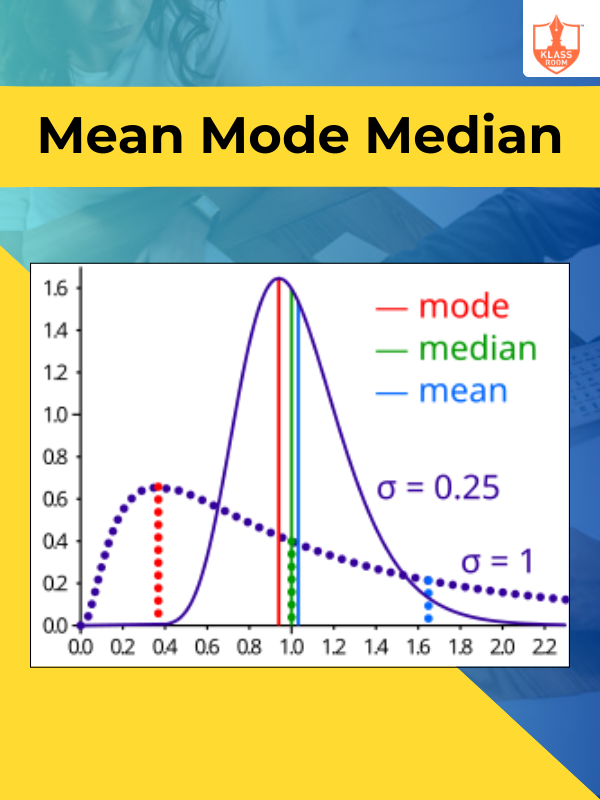
Mean Mode Median
Description: Mean is the average, mode is the most frequent value, and median is the middle value.
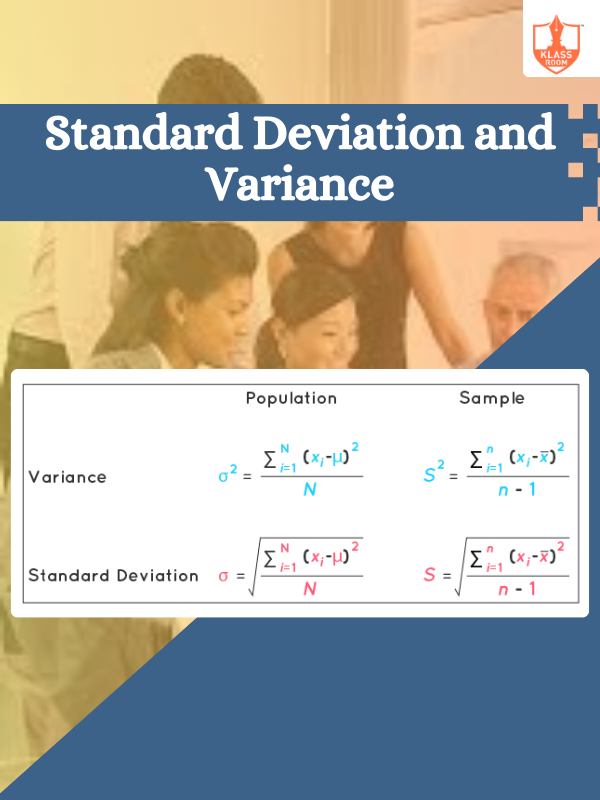
Standard Deviation and Variance
Description: Standard deviation measures data dispersion, while variance represents the average squared deviation from the mean.
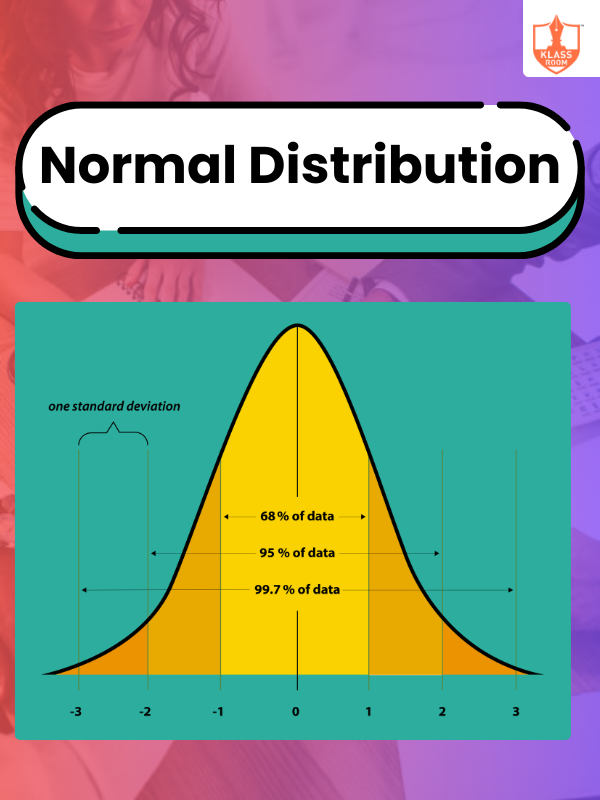
Normal Distribution
Description: Normal distribution is a bell-shaped curve representing data symmetry around the mean with predictable probabilities.
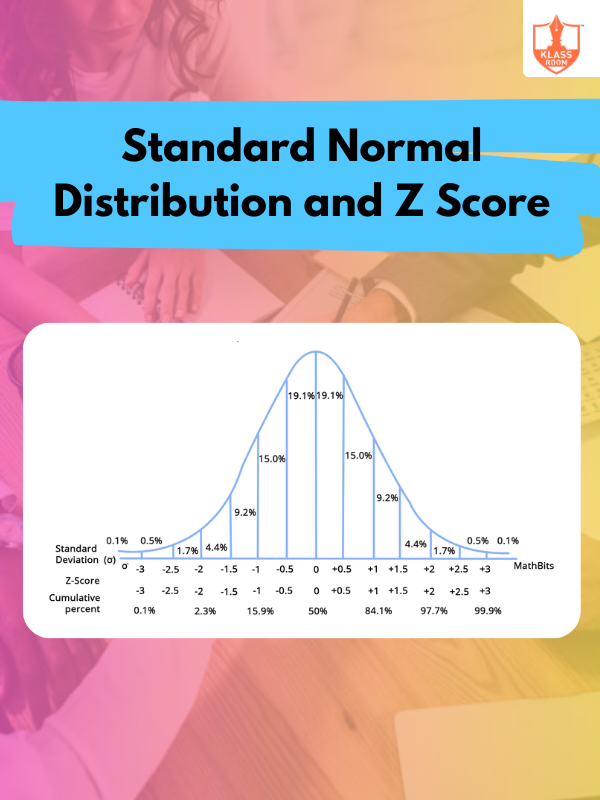
Standard Normal Distribution and Z Score
Description: Standard normal distribution is a bell curve with a mean of 0, and Z-score measures standard deviations from the mean.
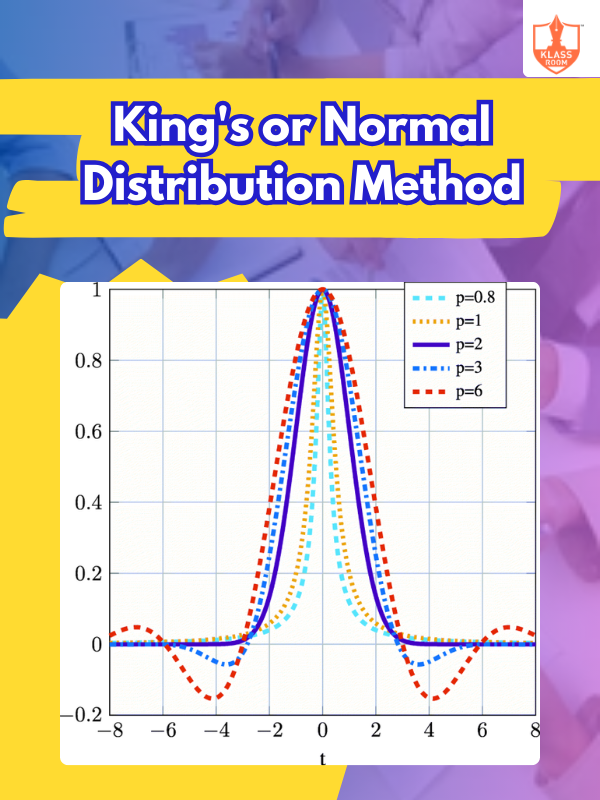
King's or Normal Distribution Method
Description: King's or normal distribution method estimates probabilities using a bell-shaped curve for data analysis and forecasting.
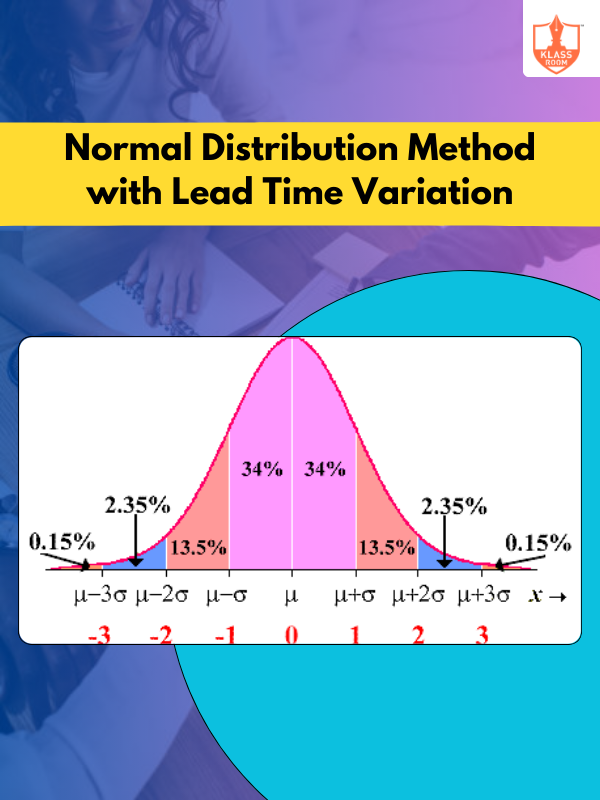
Normal Distribution Method with Lead Time Variation
Description: Normal distribution method with lead time variation accounts for fluctuating delays to optimize inventory levels and reduce stockouts.
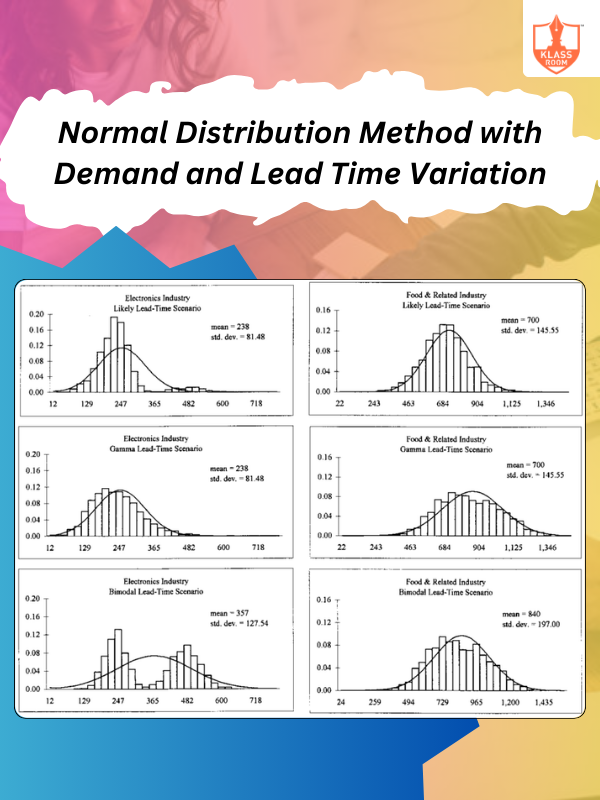
Normal Distribution Method with Demand and Lead Time Variation
Description: Normal distribution method with demand and lead time variation adjusts inventory for fluctuating demand and delays.
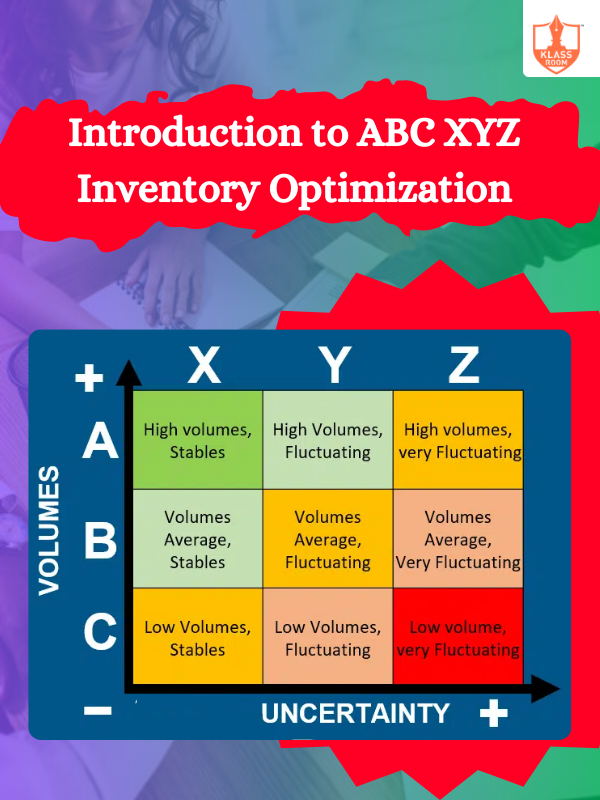
Introduction to ABC XYZ Inventory Optimization
Description: ABC XYZ inventory optimization categorizes items by value and variability, enhancing inventory management and forecasting accuracy.
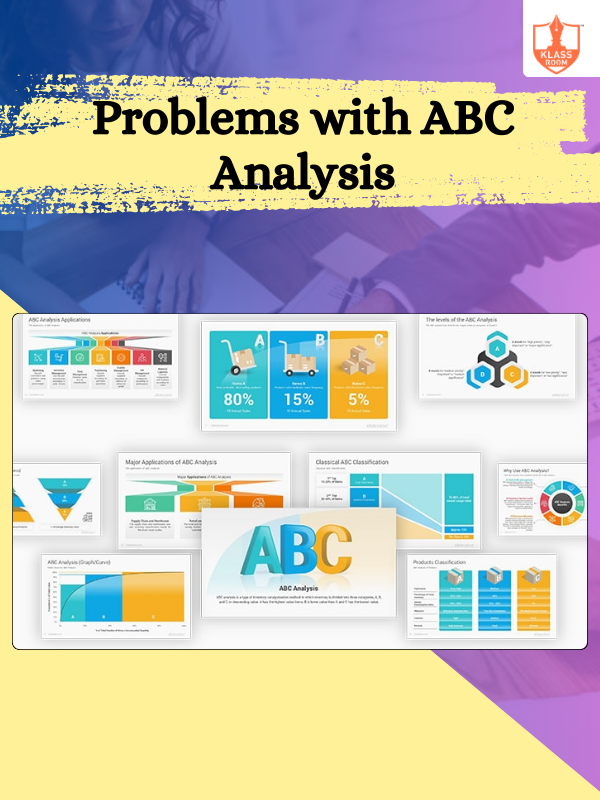
Problems with ABC Analysis
Description: Problems with ABC analysis include oversimplification, ignoring demand variability, and not accounting for market changes.
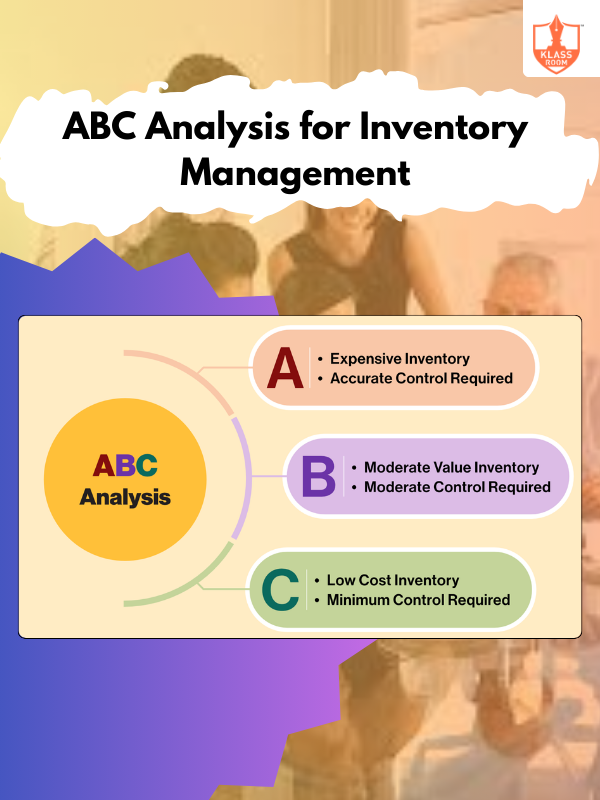
ABC Analysis for Inventory Management
Description: ABC analysis categorizes inventory into three classes (A, B, C) based on value and importance.


